
Footprint report fish feed Skretting Norway 2023
All food production has a footprint, and we in Skretting work hard to do our part as sustainable as possible. To succeed in achieving our ESG targets and constantly get better in what we do, we need to measure. We also believe that we need to be transparent and share this data with our customers and the public. That is why Skretting Norway annually publish our footprint report with information of our impact on the environment.
48 % CO2eq reduction for the feed since 2018
The raw materials we use have the biggest impact on our footprint and the Skretting fed fish. For 2023 the greenhouse emissions (GHG) reduction for 1 kg of feed was 48 percent lower than 2018, our baseline year.
The main reasons for the substantial drop in green house gas emissions are partly due to changes in the raw materials we use. (See the section about emissions for more information).
For 2022 to 2023 the carbon footprint per kg feed was reduced with 4.5 percent from 2022 so that Skretting feed in 2023 had an emission factor of 1.69 kg CO2eq per kg feed. The total emissions were reduced by 3.9 percent while our production increased by 2.2 percent. Skretting Norway's absolute GHG footprint at factory gate was 1,021,988 tonne CO2eq in 2023.
We have also worked purposefully with efficient resource and energy use for more than a decade, and our factories are today the best in class. In 2023 we transferred one of our boilers from natural gas to electricity. This reduced our scope 1 substantially, but our scope 2 increased more due to the emission factor of a market-based calculation of electricity in Norway vs. the emission factor for natural gas.
For more information and detailed GHG data go to the emission page.
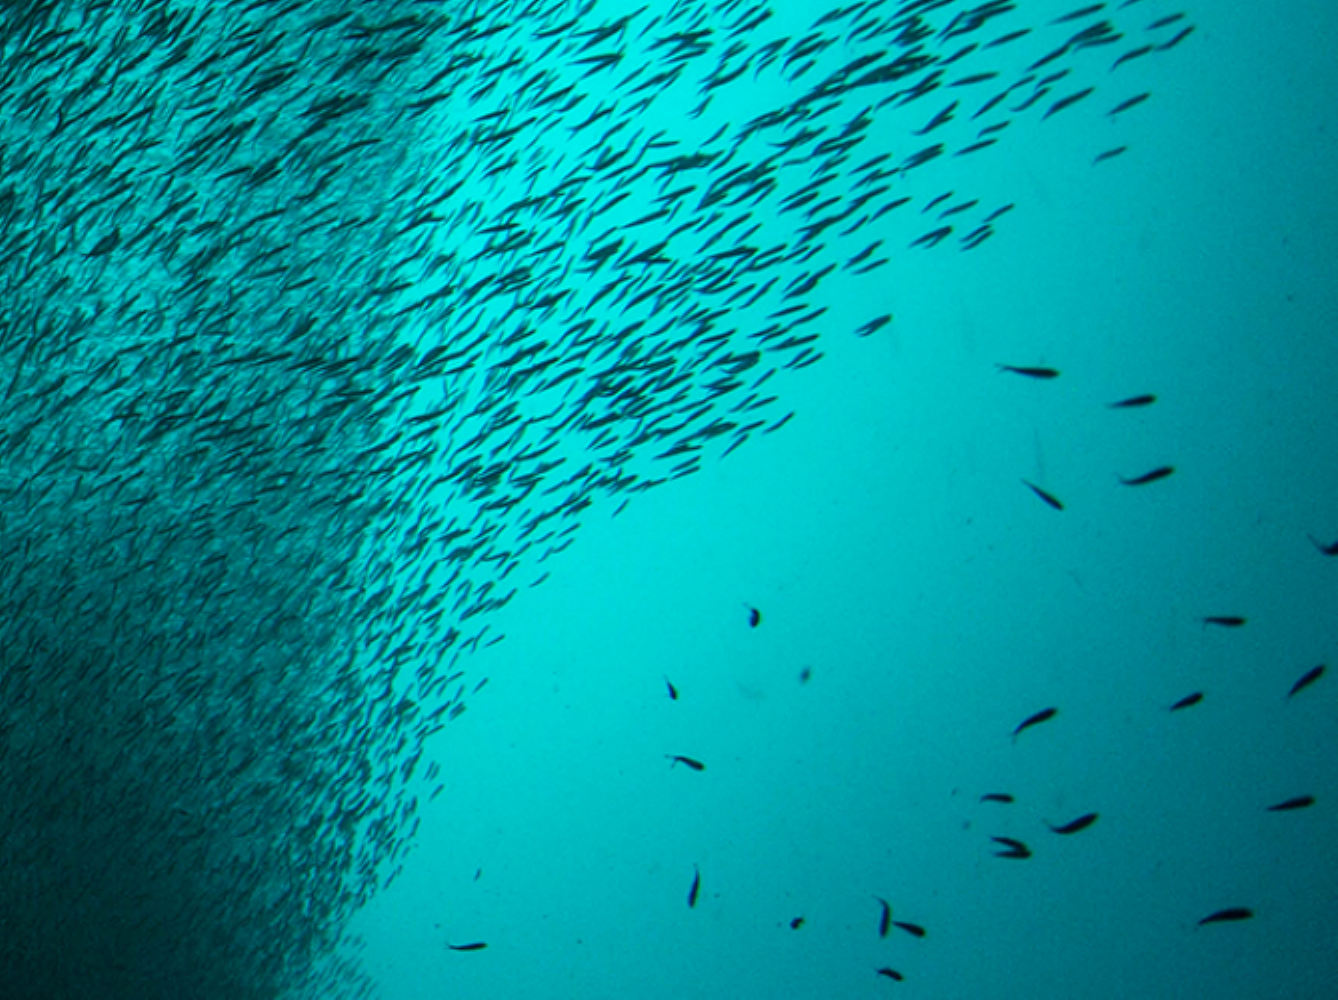
Certified and responsible fisheries
Skretting Norway only buys marine raw materials from whole fish that are certified or subject to a Fishery Improvement Project (FIP). All species and their origin can be found here, including information about the vegetable raw materials we use. Plus, other data that is important for our planet, people and animals.
The Forage Fish Dependency Ratio (FFDR) for fish oil was 1.03 and 0.51 for fish meal. The trimmings proportion in fish meal and oil combined was 25.9 percent.
For more information about the use of wild fish, certification, species and origin, go to the marine raw materials page.